Bollinger Bands place a moving average between two bands whose distance changes with recent price variability. They help describe where price sits relative to that recent distribution. A touch of the upper band does not mean price must fall, and a touch of the lower band does not mean it must rise. During a persistent trend, price can repeatedly approach the same outer band.
The calculation and examples here use 20 closing prices, a simple moving average, population standard deviation and a multiplier of two. All example prices and the illustration are synthetic educational data, not historical returns. These settings are a common starting convention, not optimized parameters or a recommendation for a particular instrument.
Understand the three lines
Middle band = average of the last 20 closes. Upper band = middle band + 2 × standard deviation. Lower band = middle band − 2 × standard deviation. For this convention, standard deviation is the square root of the average squared distance of those closes from their mean. The window advances when a new close is added.
If a fictional window has a mean of 100 and standard deviation of 2, the bands are 104 and 96. If variability increases to 3 while the mean remains 100, they widen to 106 and 94. The wider envelope describes the chosen recent sample; it does not place a floor under future prices or cap the next move.
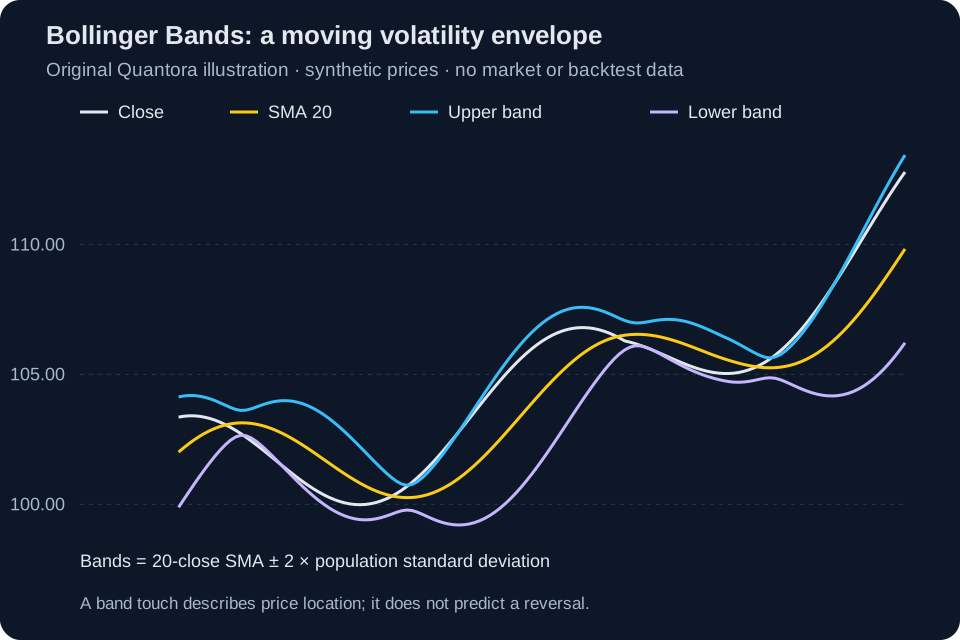
Measure width and position separately
Bandwidth can be expressed as (upper − lower) ÷ middle × 100 when the middle is positive and nonzero. In the 104/96 example, width is 8%. Percent B is (price − lower) ÷ (upper − lower) when the bands differ. A price of 103 gives 7 ÷ 8 = 0.875, meaning it lies 87.5% of the way from lower to upper.
Percent B can exceed one or be below zero when price is outside the bands. That is a valid calculation, not a malfunction. A narrow width describes compression relative to price; calling it a squeeze also requires a reference, such as its own prior distribution over a specified sample. A fixed width threshold is not automatically comparable across instruments or timeframes.
Two hypotheses need two tests
| Hypothesis | Rule that must be specified | Failure to include |
|---|---|---|
| Range reaction | How a completed candle returns inside a band and where invalidation lies | A continuing trend that repeatedly touches the outer band |
| Squeeze expansion | The width threshold, reference period and completed-close trigger | A brief break that returns inside the range |
| Trend continuation | What constitutes a trend and an eligible pullback | Repeated entries late in an exhausted move |
Make a squeeze example reproducible
For a fictional research rule, define compression using only previous completed bandwidth values, then require a completed close beyond the upper band. Record the reference window, percentile calculation and whether the crossing compares the previous and current bands. A band moves with the new price, so testing against a frozen earlier value and testing against the current band are different rules.
Specify expiry, exit and maximum simultaneous positions before evaluating the sample. A breakout that reverses must remain a loss or failed condition in the record; it cannot become a range setup after the fact. If the available history is too short for the reference window, label the reading unavailable rather than quietly calculating from fewer bars.
Risk and execution still sit outside the indicator
A planned stop must be converted from price distance into cash using the contract and position size. Wider bands do not justify holding an unchanged large position with a much wider stop while claiming the same risk. Include spread, commission, gaps and slippage when evaluating the outcome. A band-derived target is a moving reference, so state whether it is fixed at entry or updated later.
Choose parameters on a designated development period, then evaluate the frozen rule on other data and demo execution. Compare a simple reference strategy and keep all tested variants in the notes. Selecting whichever period or multiplier looks best on the finished chart can exaggerate the apparent evidence.
Checklist and frequently asked questions
Do two deviations mean 95% of future prices must stay inside? No. That inference would require distribution assumptions not established by these moving chart bands. Does a squeeze identify direction? No; compression alone does not choose up or down. Can bands differ between platforms? Yes; settings, data and implementation conventions need to match before values are compared.
- Record period, price input, average type, deviation convention, multiplier and chart shift.
- Use completed bars consistently and retain enough warm-up observations.
- Distinguish compression, trend and range hypotheses before testing an entry.
- Keep costs, losing breaks and parameter selection history with the result.