An exponential moving average smooths a price series while weighting recent observations more heavily. A 20-period EMA responds faster than a 200-period EMA using the same prices. The difference can help describe a trend or pullback, but none of these lines establishes a fair value or guarantees where price will turn.
The examples use closing prices, zero chart shift and the conventional weighting factor 2 ÷ (period + 1). Every number and plotted price is hypothetical. The chart illustrates how three calculations respond to one sequence, not the historical performance of a trading strategy.
Calculate one update before interpreting the line
EMA now = previous EMA + weight × (new close − previous EMA). For EMA 20, the weight is 2 ÷ 21, or about 9.52%. Assume the previous EMA is 100 and the next close is 110. The new value is 100 + (2 ÷ 21) × 10 = 100.95238…, not the new closing price itself.
Using the same starting average and close isolates the effect of period length. In a real chart the previous EMA 20, 50 and 200 will usually be different, so the following comparison is a calculation exercise rather than three actual observations.
| Period | New-close weight | Updated EMA |
|---|---|---|
| 20 | 2 ÷ 21 ≈ 9.52% | 100.9524 |
| 50 | 2 ÷ 51 ≈ 3.92% | 100.3922 |
| 200 | 2 ÷ 201 ≈ 1.00% | 100.0995 |
Twenty periods does not always mean twenty days
On a daily chart EMA 20 updates with daily observations; on an hourly chart it updates with hourly observations. Trading-session gaps, missing bars and the provider's session definition affect the sequence. Compare averages only after matching timeframe, applied price and data feed.
Initialization matters too. For our illustration, each EMA starts with the simple average of its first N closing prices, then updates recursively. The displayed window begins after 500 observations, so all three averages already have history. Other implementations can use a different seed; more warm-up reduces its influence but does not make differing data feeds identical.
An open candle's price can move above and below a line before the close. A chart shift moves the display without creating new price information. Keep the calculation settings visible when documenting a crossover, and distinguish an intrabar event from a condition checked at a completed close.
An original trend-and-pullback example
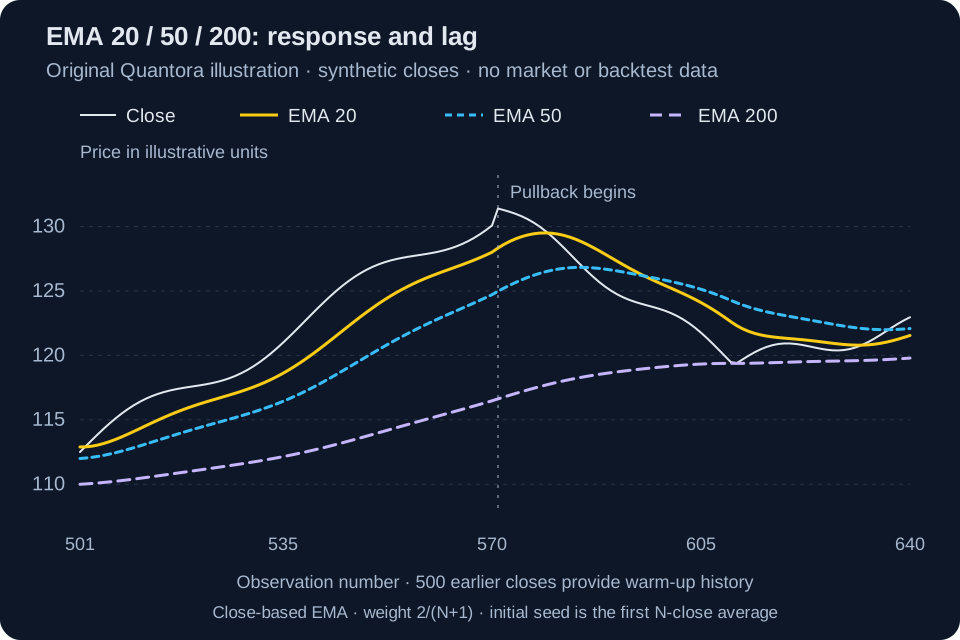
The synthetic sequence below first rises, then pulls back. EMA 20 follows the change more closely, EMA 50 reacts more slowly and EMA 200 remains influenced by a longer history. A close below the faster average can happen while the slower averages still slope upward. That observation alone does not decide whether the event is a temporary pullback or a lasting change.
All lines use the same closes. There are no projected prices and no future bars used in an earlier value. The drawing omits intrabar ranges and trading costs, so it cannot identify an executable stop or validate a profitable entry rule.
A crossover needs a rule and a cost model
A faster average crossing above a slower one describes a change in their relative values. It does not tell you whether a move has already travelled far, whether nearby resistance limits the next move or whether the spread makes an entry uneconomic. In a sideways sequence, repeated crossings can produce several conflicting signals.
To evaluate a crossover idea, define the exact periods, price input, completed-bar condition, next executable entry, exit and sizing rules before reviewing the outcome. Entering at the same closing price that confirmed a signal can be an unrealistic assumption. Include rejected orders, gaps and costs rather than keeping only the smooth examples.
Likewise, calling an EMA support does not make it a protective order. A price can pass through the line. Specify the independent invalidation level and loss estimate, and remember that a stop can execute beyond its requested level.
Quantora's scanner uses 21, 50 and 200
The existing Market Scanner uses daily EMA 21, 50 and 200 rather than EMA 20, 50 and 200. Its tags identify price above or below the available averages; they do not certify a profitable moving-average system. A 21-period result is close in concept to 20 but is a different calculation and can classify a near-line price differently.
Check the snapshot's data status and the corresponding chart. A missing 200-period reading can mean insufficient history; do not replace it with a made-up value or read an absent tag as evidence of a trend. The tool's curated symbol list is a screening aid, not every instrument offered by your broker.
Keep a useful chart-review record
- Save symbol, data provider, timeframe, date, EMA periods, applied price and shift with the example.
- Describe price structure and the slope of each average separately from any proposed trading action.
- Record whether the price is extended from the average and what happens near nearby support or resistance.
- Specify the rule before testing it, use adequate warm-up and keep out-of-sample and losing examples.
- Review total exposure and execution costs independently. Three correlated averages are not three independent confirmations of safety.
Common questions
- Is EMA 200 a universal trend boundary? No. It is a chosen smoothing period on a chosen timeframe, and price can repeatedly cross it.
- Is EMA better than SMA? They weight history differently. Faster response also means more sensitivity; a preference needs a defined use and evidence.
- Can EMA 20 and EMA 21 be substituted without checking? No. Their weights differ, which can change a borderline signal and its timing.
- Does this chart show which periods to trade? No. It illustrates arithmetic and lag. It does not establish a trading edge or a suitable risk level.