RSI compares the size of recent upward and downward price changes in one price series. It helps describe momentum; it does not tell you that an asset is cheap, expensive or about to reverse. A reading above 70 can accompany a trend that keeps rising, and a reading below 30 can accompany further losses.
This guide uses RSI 14 applied to closing prices. Its calculation examples and chart are hypothetical, created to explain the indicator rather than to demonstrate a profitable system. Before comparing readings, match the symbol, timeframe, applied price, period and whether the latest candle has closed.
What RSI 14 measures
Fourteen refers to price-change periods, not necessarily days. On a daily chart those periods are daily bars; on an hourly chart they are hourly bars. Fourteen changes require fifteen closing prices to initialize the calculation. Separate each change into a non-negative gain and loss: a rise of 0.80 gives gain 0.80 and loss zero; a fall of 0.40 gives gain zero and loss 0.40.
In the Wilder-style calculation used for our chart, the first average gain and loss are arithmetic averages of fourteen changes. Each later average is updated as (previous average × 13 + current gain or loss) ÷ 14. This preserves a declining contribution from older changes instead of simply dropping the oldest observation.
Relative strength here means average gain ÷ average loss. RSI = 100 − 100 ÷ (1 + relative strength). It is a comparison within that instrument, not a stock's performance relative to an index. When there are gains but no average losses the limiting value is 100; when there are losses but no gains it is zero. A completely flat initialization requires a platform convention, so compare implementations rather than dividing zero by zero.
Work through the numbers
Suppose the current smoothed average gain is 1.20 price units and the average loss is 0.40. Their ratio is 3, so RSI = 100 − 100 ÷ 4 = 75. This says the smoothed gains are three times the smoothed losses in this example; it does not mean there is a 75% chance of an upward move.
If the next close falls by 1.40, the new gain average is (1.20 × 13 + 0) ÷ 14 = 1.1142857… and the loss average is (0.40 × 13 + 1.40) ÷ 14 = 0.4714286…. Carrying the unrounded values into the formula gives RSI about 70.27. One negative bar has reduced momentum, but it has not automatically changed the overall price trend.
| Average gain | Average loss | Calculated RSI |
|---|---|---|
| 1.20 | 0.40 | 75 |
| 1.00 | 1.00 | 50 |
| 0.40 | 1.20 | 25 |
Read the chart before acting on a zone
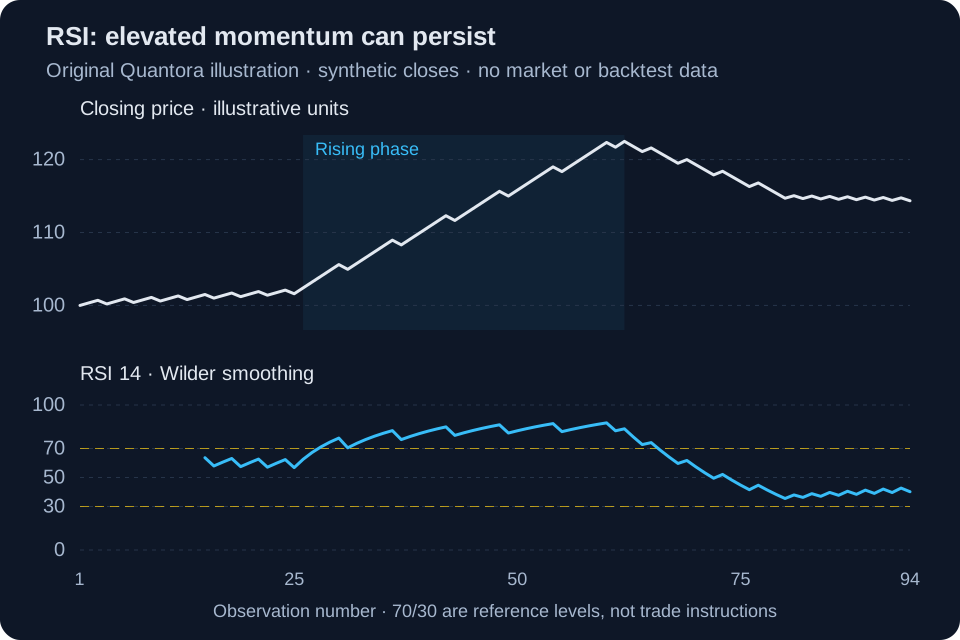
In the middle rising section of this original illustration, RSI moves above 70 while the closing-price line continues higher. Selling at the first overbought reading would be a separate trading decision, not a conclusion established by the indicator. Later the series pulls back and RSI declines as the balance of recent changes shifts.
Read the price structure alongside the oscillator. A pullback inside an established rise, a sideways range and a breakdown can all produce similar RSI readings with different context. The line is computed from closes only; it does not show intrabar highs, lows, executable Bid/Ask prices or trading costs.
Divergence is a question to investigate
Bearish divergence describes a higher price peak alongside a lower RSI peak. Bullish divergence describes a lower price trough alongside a higher RSI trough. Compare recognizable swings on the same timeframe and explain which bars you selected; moving the comparison points after seeing the outcome can make the pattern appear more convincing than it was at the time.
Divergence does not specify when price must reverse or where an order should be placed. Price can continue in the same direction, form another swing or remain in a range. A useful journal entry records the pattern before the result, the price condition that would invalidate the interpretation, and the actual fills and costs if a trade was taken.
Use Quantora's scanner as a starting point
The existing Market Scanner labels available RSI readings below 30 as oversold and above 70 as overbought. These are threshold descriptions, not buy or sell instructions. Its technical snapshot is calculated from daily candles and may be cached; inspect the displayed data status and the source chart before using a tag.
Do not expect a scanner's daily RSI to match an MT5 five-minute chart, a different broker feed or an unfinished candle. Check the corresponding timeframe and close history. The scanner is a way to organize a review, not a substitute for specifying an entry, invalidation, position size and total exposure.
A repeatable review checklist
- Record symbol, timeframe, RSI period, applied price and candle timestamp before comparing charts.
- Describe the price trend or range independently of the RSI zone. Note nearby structure and any pending news.
- Treat an unfinished candle as provisional. Record what changed after the candle actually closed.
- If testing a rule, define it before inspecting later bars and include spread, commission, execution and losing examples.
- Size any proposed exposure separately. RSI cannot cap losses, prevent gaps or manage several open trades for you.
Common questions
- Does oversold mean buy? No. The label describes the recent balance of changes; price can continue falling.
- Is RSI 14 always the best period? No period is established as best by these examples. Changing it changes sensitivity and must be evaluated against a defined purpose.
- Why do two RSI charts disagree? Check timeframe, feed, applied price, candle completion, smoothing and the amount of initialization history.
- Is crossing 50 a complete strategy? It is one observable event. It does not supply execution rules, risk limits or evidence of an edge after costs.