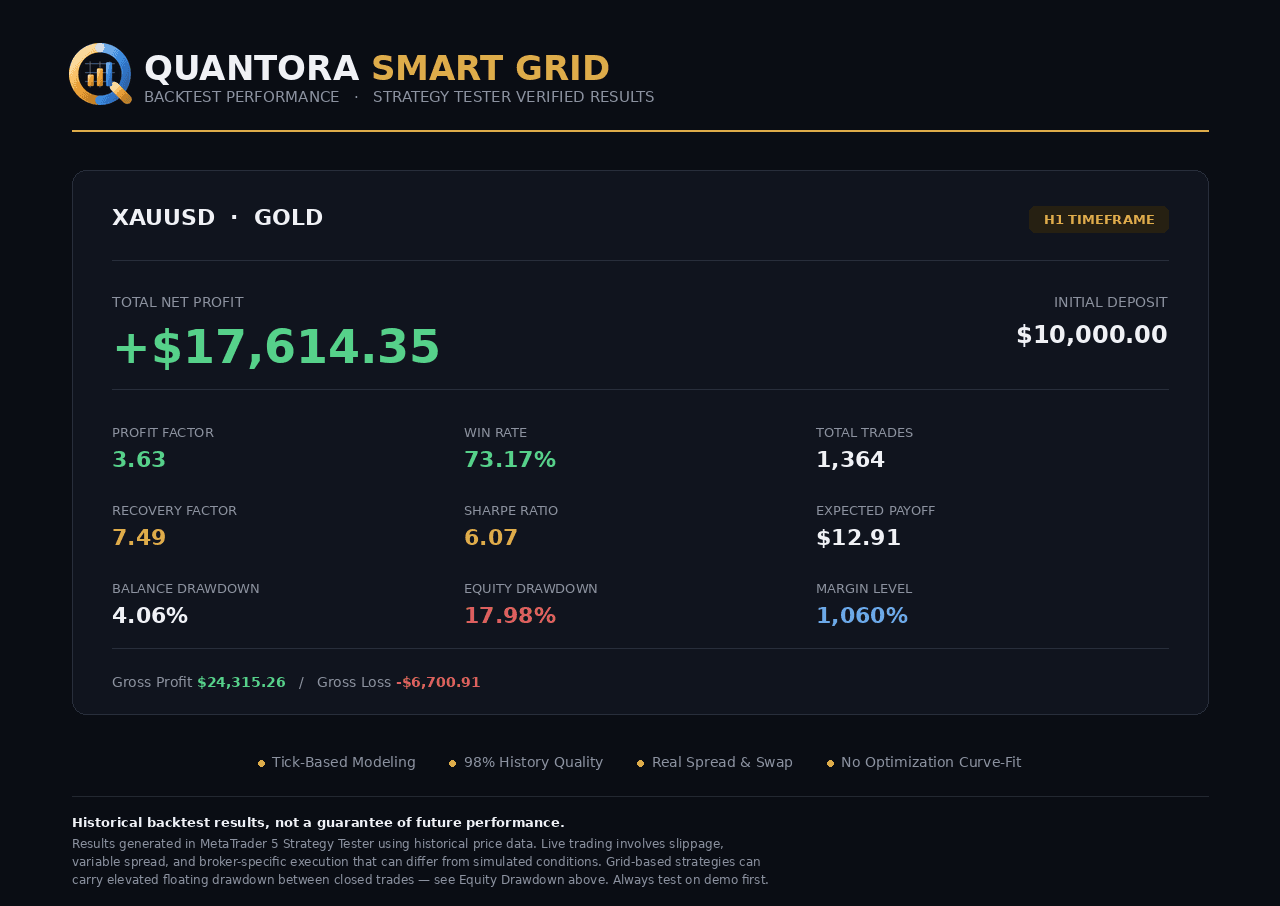
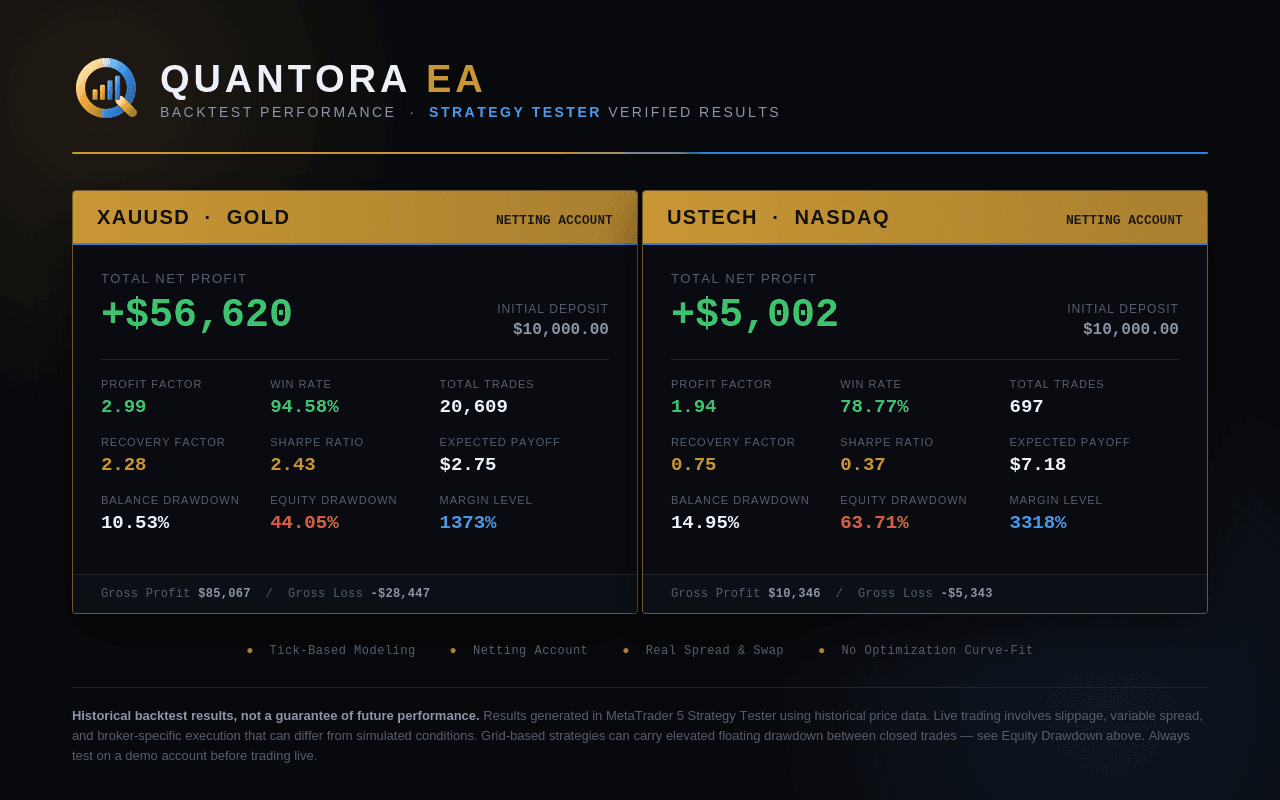
EA sellers may advertise "live results verified on Myfxbook". Some linked records are verified, some are demo accounts, some show large drawdowns, and some stopped updating months ago. The link itself is not the proof — what's on the page is. Here is what to look at before relying on a headline gain figure.
1. Two green badges: Track Record and Trading Privileges
Check the account's Track Record and Trading Privileges verification status. Myfxbook describes Track Record verification as a match between the displayed trading history and the broker's platform history. Trading Privileges verification confirms that the person who added the account holds the master password, indicating ownership or the ability to trade. Neither status guarantees profitability or identifies which EA placed each trade.
Verification and freshness are different checks. Inspect the last update time as well as the verification status; a verified account can still contain an old record.
2. Real or demo, and which broker
Check whether the account is labelled Real or Demo and read its account currency. A demo account observes market prices without risking real funds, but its execution and costs can differ from a funded account. A cent-denominated balance must also be interpreted using the account's currency units.
Read the broker, server and account type. Even at the same broker, spreads, commissions, latency and execution can differ between accounts; a familiar broker name does not guarantee identical results for you.
3. Drawdown before gain
Look at the Drawdown figure before you look at Gain. A +90% gain with 30% drawdown and a +90% gain with 75% drawdown are completely different products: the second one was one bad week away from zero. Drawdown is the number that tells you what it felt like to hold the account, and what deposit you need to survive the next one.
Then open the Drawdown tab on the chart. A single deep spike that recovered is a different story from drawdown that ratchets deeper every month.
4. Abs. Gain vs Gain, and the deposits line
Gain is compounded; Abs. Gain is profit divided by total deposits. When they diverge a lot, money was added or withdrawn along the way. That's not wrong — but a page showing +200% gain on an account that was topped up five times after losses is telling you something the headline number hides. Scroll down to Deposits and Withdrawals and read the dates.
5. Trade count and age
Twenty winning trades in three weeks is a coin flip that came up heads. Look for at least a few hundred closed trades over several months, ideally crossing at least one nasty news event (NFP, FOMC, a CPI surprise). The Info tab shows the start date; the Trading Activity section shows total trades.
6. Profit factor and average win vs average loss
In Advanced Statistics: profit factor is gross profit ÷ gross loss. Above 1.5 is healthy for a grid, above 2 is good, above 5 usually means very few losses so far — check the trade count. Then compare Average Win to Average Loss in currency. A 90% win rate with an average loss ten times the average win is the classic martingale shape: many small wins, one large loss that erases them.
7. The equity line, not just the balance line
The Growth chart draws balance (closed trades) and equity (including floating P&L). A balance line that climbs smoothly while equity dives underneath it means open losing positions are being carried — the classic look of a grid holding a basket. The gap between the two lines at its widest is the drawdown you would actually have experienced.
8. Open trades right now
The Open Trades tab shows what's floating today. A large negative floating P&L relative to balance means the account is in drawdown at this moment, regardless of how green the history looks. For a grid EA, the number of open positions tells you how deep the current basket is.
9. Does the history match the product?
Open the History tab and check the symbols, lot sizes and comments. If the EA is sold as "XAUUSD H1" and the history is full of EURUSD manual trades, the page isn't tracking the product. Magic numbers and trade comments usually carry the EA's name.
10. Is it still updating?
An old update timestamp means the displayed record is stale. It does not explain why updates stopped. Review the available trading period, open positions and gaps in the record before comparing it with a currently updating account.
How Quantora Robots publishes results
Quantora shows Myfxbook links for products with a configured tracking account. Other products may have historical backtests or screenshots only. Open the linked Myfxbook record to inspect its verification status, account type and latest update rather than assuming that every product has the same evidence.
The scheduled daily sync attempts to refresh configured accounts. If the provider or database is unavailable, the website can show cached figures or a fallback. A daily schedule is not a guarantee of a fresh result: check the displayed update time and the original account page.