Moving Average Convergence/Divergence, or MACD, compares two moving averages of the same price series. It summarizes their separation and how that separation changes. A positive MACD says the shorter average is above the longer one; it does not say the next candle will rise, and a crossover is not a complete entry or risk-management plan.
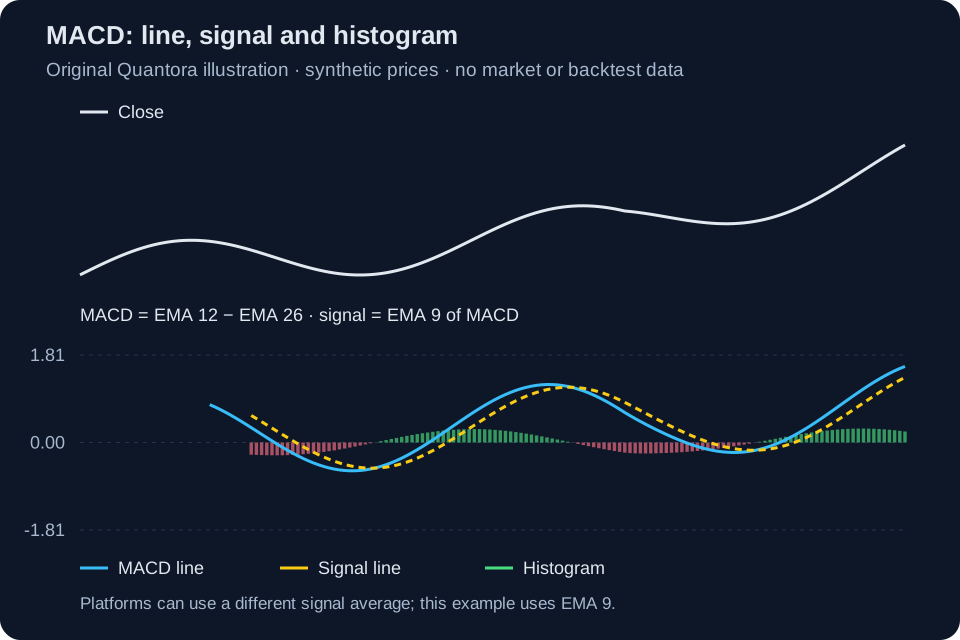
This guide's main illustration uses EMA12 minus EMA26, with an EMA9 of that result as the signal line. Its histogram is MACD minus signal. All plotted prices and numbers are synthetic educational examples. Platform conventions differ, including an important distinction in MT5, so check exactly what the displayed bars represent before comparing charts.
Calculate the parts in order
For the illustrated convention, MACD = EMA12 − EMA26. Signal = EMA9 of MACD. Difference histogram = MACD − signal. A conventional EMA update weights the newest observation by 2 ÷ (period + 1), with the remainder on the prior EMA. A calculation must also define its initial seed; early values can differ if two implementations start from different history.
Suppose fictional EMA12 is 105 and EMA26 is 102: MACD is +3. If signal is +2, the difference histogram is +1. Later, MACD can decline to +2 while signal is +2.5, giving a histogram of −0.5. MACD is still above zero, yet it has moved below its signal. These are different observations, not a contradiction.
Separate three chart observations
| MACD | Signal | Difference histogram | Reading |
|---|---|---|---|
| +3.0 | +2.0 | +1.0 | Shorter EMA is higher; MACD is above signal |
| +2.0 | +2.5 | −0.5 | Shorter EMA remains higher; MACD is below signal |
| −1.0 | −2.0 | +1.0 | Shorter EMA remains lower; MACD is above signal |
Read your platform's bars and signal method
MetaQuotes documents MT5's built-in MACD signal as a nine-period simple moving average of MACD, whereas the common convention described by Fidelity uses a nine-period EMA. MT5's built-in MACD bars show the MACD value itself; the platform's Moving Average of Oscillator, or OsMA, represents the difference from its signal. A histogram-shaped plot is therefore not necessarily the difference histogram shown here.
When reproducing a screenshot, record fast and slow periods, applied price, signal method and plotted series. Compare actual numerical values rather than relying on colors or bar height. Changing from SMA to EMA can move the crossover time even with identical closes, so claims about one implementation should not be silently transferred to another.
A shrinking histogram is not a price reversal
A positive difference histogram that shrinks means MACD is becoming less far above its signal. Price can still be rising while that happens. The indicator measures relationships between smoothed series; slowing acceleration and a reversal are different ideas. A zero-line crossing of MACD also differs from a zero-line crossing of the difference histogram.
Divergence compares declared price swings with declared indicator swings. In a fictional example, price makes a higher completed swing high while MACD makes a lower one. That can be logged as bearish divergence under the chosen rule, but it does not establish the timing or existence of a later decline. Include the delay needed to confirm both swings.
Test a crossover as a rule, not a picture
A study might define a signal only when the previous completed MACD value was at or below signal and the current completed value is above it. Specify how exact equality is handled, when an order could first be executed and which exit is used. A crossover appearing on the still-forming bar can disappear before the close.
Choppy conditions can produce repeated crosses with little net progress. Keep those sequences and their costs in the report. Reserve a separate evaluation period, check different environments and document any parameter changes. Stacking RSI, EMA and MACD confirmations does not create independent evidence when all are transformations of substantially the same prices.
Frequently asked questions
Does MACD above zero mean buy? No; it describes average separation. Can a positive histogram coexist with negative MACD? Yes, as the third table row shows. Why do two MACD charts disagree? Check the feed, timeframe, seed history, applied price, signal average and whether the bars show MACD or its difference from signal before treating the mismatch as a bug.
Before comparing MACD examples
- Identify the plotted series and the signal averaging method.
- Match data, timeframe, applied price and warm-up history.
- Use completed-bar triggers and keep whipsaws in the sample.
- Record costs and the exit rule beside each crossover result.